
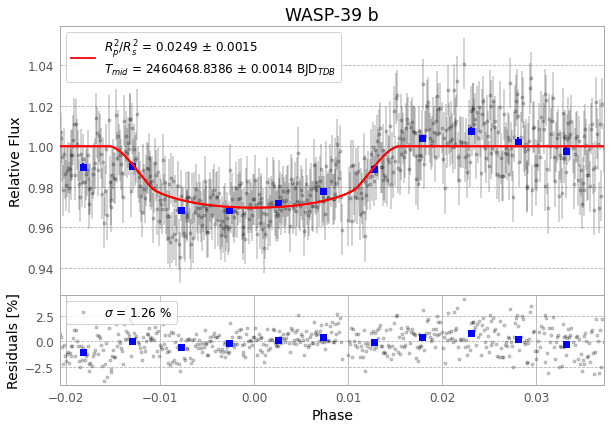
Estimate the transit depth
Start with the upper panel of the plot. Each point is a brightness measurement. Find a stretch before or after the dip and estimate the usual brightness there. Then estimate the brightness near the bottom of the dip. Use several points for each estimate.
Subtract the in-transit brightness from the out-of-transit brightness. Divide the difference by the out-of-transit brightness and multiply by 100. Report the percentage of starlight blocked during this observation.
Check your reading of the graph
Near phase zero, the red curve reaches about 0.97. Outside the transit it sits at 1.00. By eye, the dip is about 3%. The legend gives a different quantity: the fitted planet-to-star area ratio, 0.0249. The stellar disk varies in brightness from center to edge, so the deepest point need not equal that area ratio.
Compare your estimate with a classmate’s
Mark the intervals you each used. How much does your answer change if you move one interval? Explain which points you would keep and why.
The lower panel shows the residuals, the differences between the measurements and the fitted model. Find a stretch where several points fall on the same side of zero. Describe how that pattern affects your confidence in the depth estimate.
Extend the activity into a research project
How much does the choice of comparison star affect your result? Choose one observing sequence from the public archive. Reduce it twice with the same frames and settings, changing one comparison star. Record the depth and uncertainty for each fit.
Turn in the two curves, your comparison-star choices and a paragraph explaining the difference. Both reductions use the same night of data. Identify one other observing night you could use to check your conclusion.